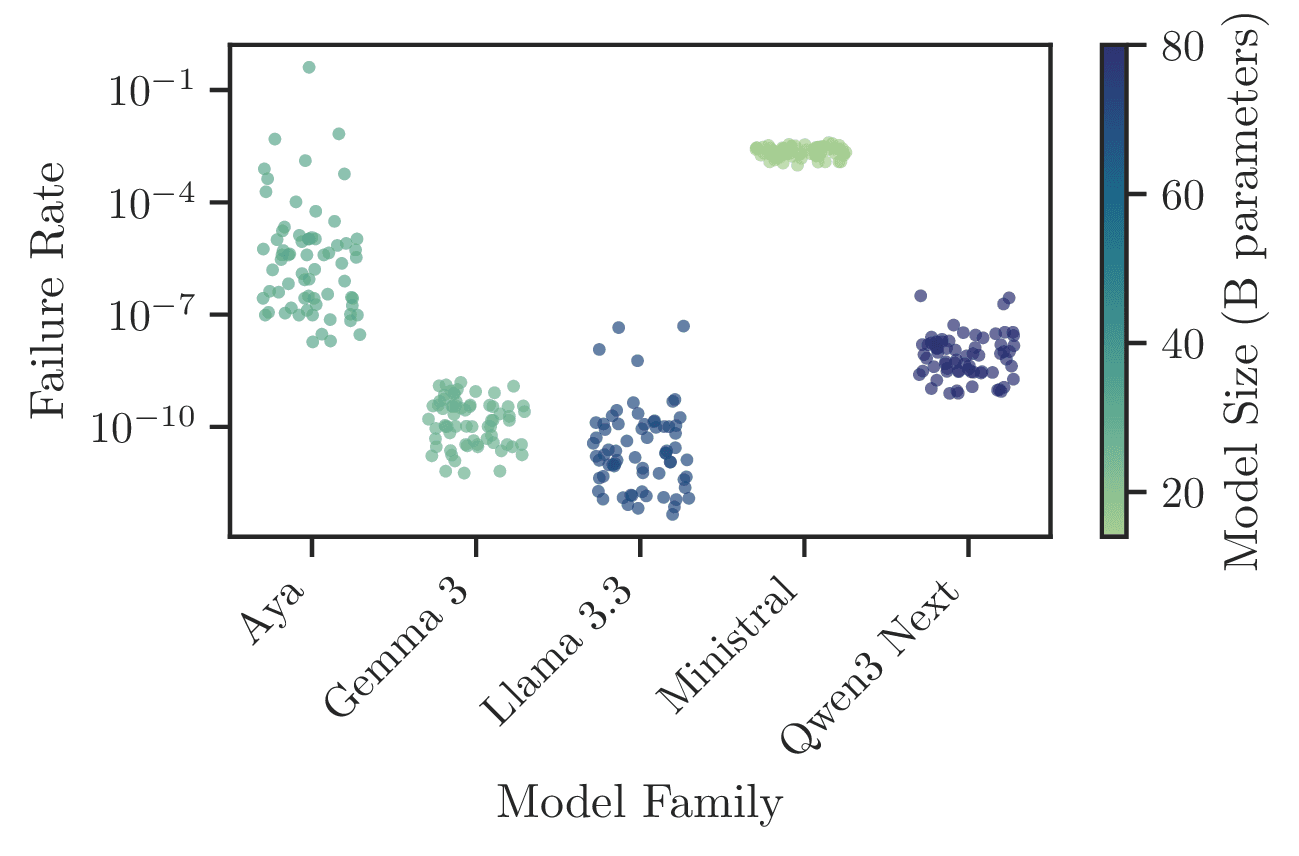
Can the model even follow the task?
We define the valid token set as the subset of vocabulary tokens that map to the allowed Likert responses 1–7. Any probability mass outside means the model fence-sat or hallucinated out of range and cannot be used.
Probability mass that falls outside the valid token set. the model's rate of non-adherence to the numeric constraint.
Subsequent analysis (Layers 2 and 3) operates on the renormalized distribution restricted to analogous to excluding non-compliant participants in human studies.
Why entropy fails for Likert scales
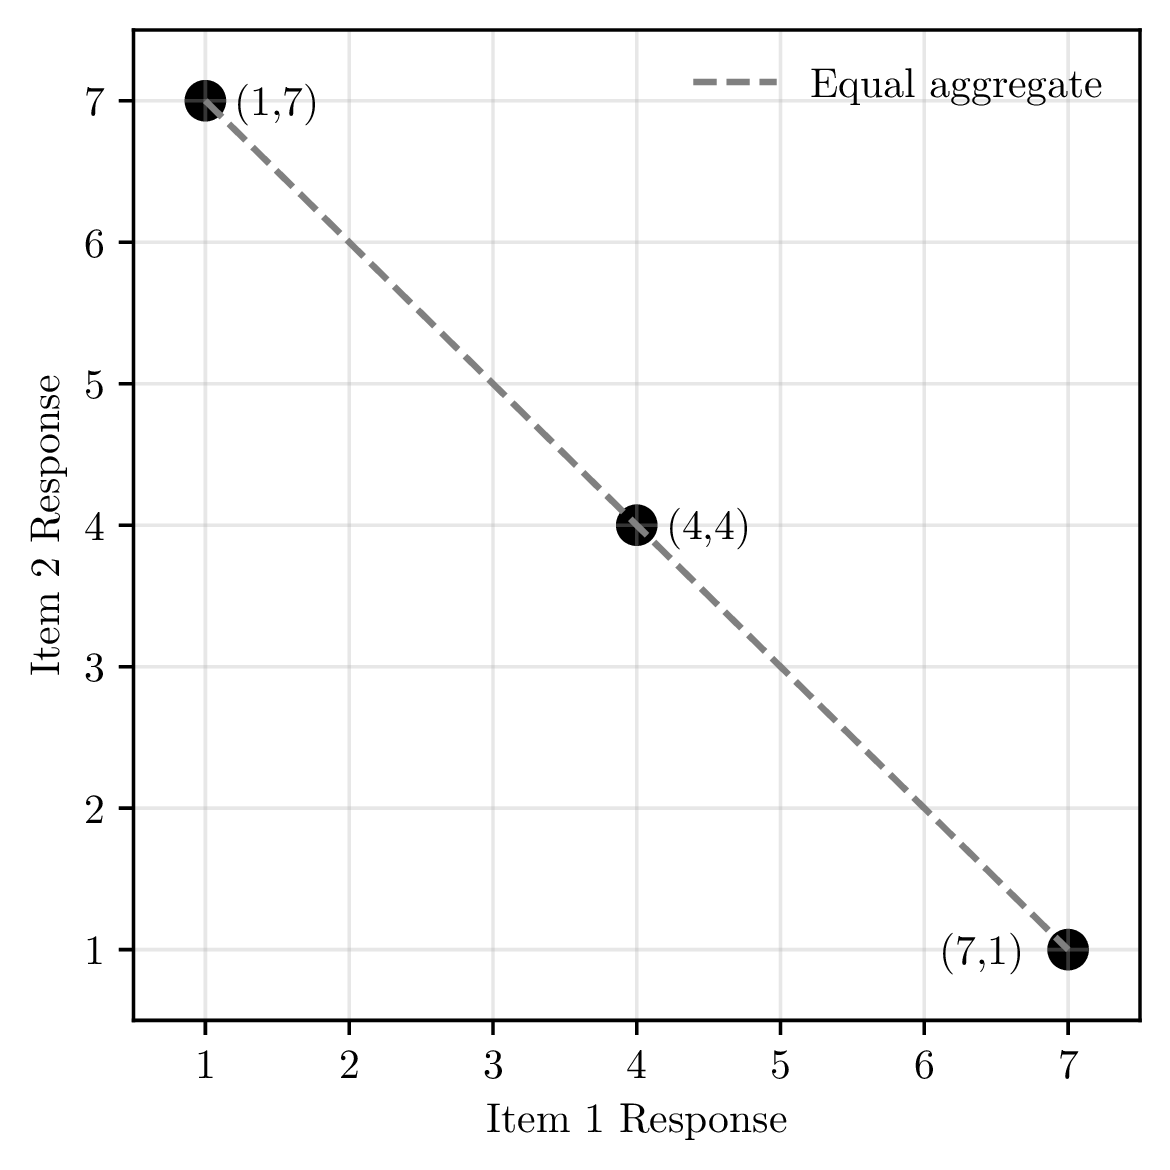
Identical means can mask fundamentally different regimes, a model polarized between 1 and 7 looks the same as one concentrated on 4.
Traditional measures of dispersion, such as Shannon entropy, assume categorical values. They are agnostic to the distances between responses.
Entropy alone cannot distinguish these three distributions.
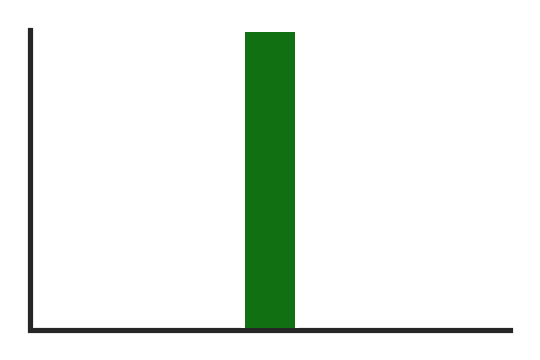
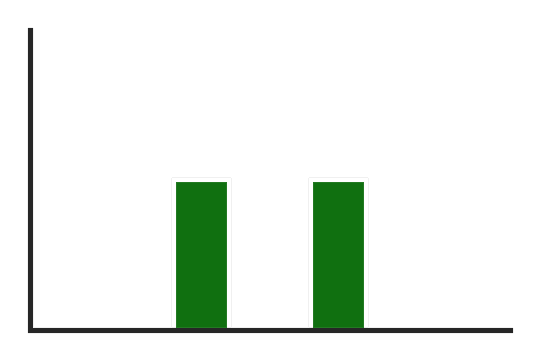
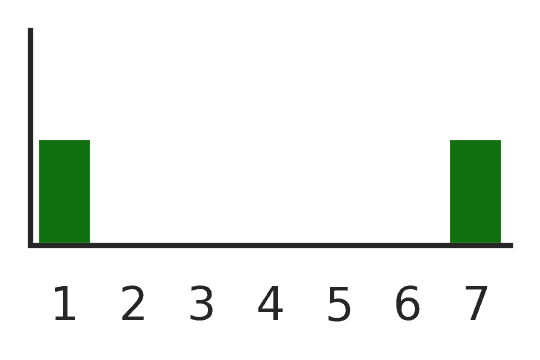
Rows 2 and 3 have identical entropy (H = 1.00) but represent completely different behavior: entropy is blind to ordinal distance.
Measuring internal consistency
To remedy this, we use a multidimensional consensus measure. It penalizes spread in proportion to the ordinal distances between responses.
where is the itemwise mean vector and is the maximum diagonal distance on the Likert scale.
This demonstrates the level of internal consistency, or polarization, a model has on our ethnocentrism scale. High consensus means probability mass is tightly concentrated; high dissension means it is spread across opposing poles.
Convolving a multi-item scale collapses polarization.
Five models. Four national targets.
A fully crossed 5 × 4 factorial design using CETSCALE — the validated consumer ethnocentrism measurement instrument — adapted for national attribution.
Model factor
Fully crossed design (5 models × 4 targets = 20 conditions)
LLMs score at the extreme end of human ethnocentrism
Composite CETSCALE scores (sum of 17 items, range 17-119) for the Target = USA condition. Human data are historical population samples from Shimp and Sharma (1987). Several models exceed the most ethnocentric human population ever recorded.
Human populations
LLMs (Target = USA)
Vertical line marks the highest human population mean (Detroit, 68.58).
Aya far exceeds human ethnocentrism; China is the most disfavored country
The exact-PMF Hoeffding decomposition isolates model and country main effects as distributions centered on the grand mean (). Robustness is assessed via SNR and dPD — no p-values, no sampling assumptions.
Model main effects (, deviation from )
| Model | ||||
|---|---|---|---|---|
| +21.19 | 13.01 | 1.63 | >0.99 | |
| +5.11 | 9.59 | 0.53 | 0.62 | |
| +0.31 | 12.79 | 0.02 | 0.55 | |
| -11.99 | 13.15 | 0.91 | 0.77 | |
| -14.63 | 12.17 | 1.20 | 0.93 |
Country main effects (, deviation from )
| Country | ||||
|---|---|---|---|---|
| +4.62 | 5.72 | 0.81 | 0.90 | |
| +2.84 | 5.43 | 0.52 | 0.55 | |
| -1.00 | 4.72 | 0.21 | 0.54 | |
| -6.46 | 6.19 | 1.04 | 0.95 |
. = directional probability of difference (Bayesian analog of one-sided p-value). Robust rows highlighted.
The model's origin shapes which countries it devalues
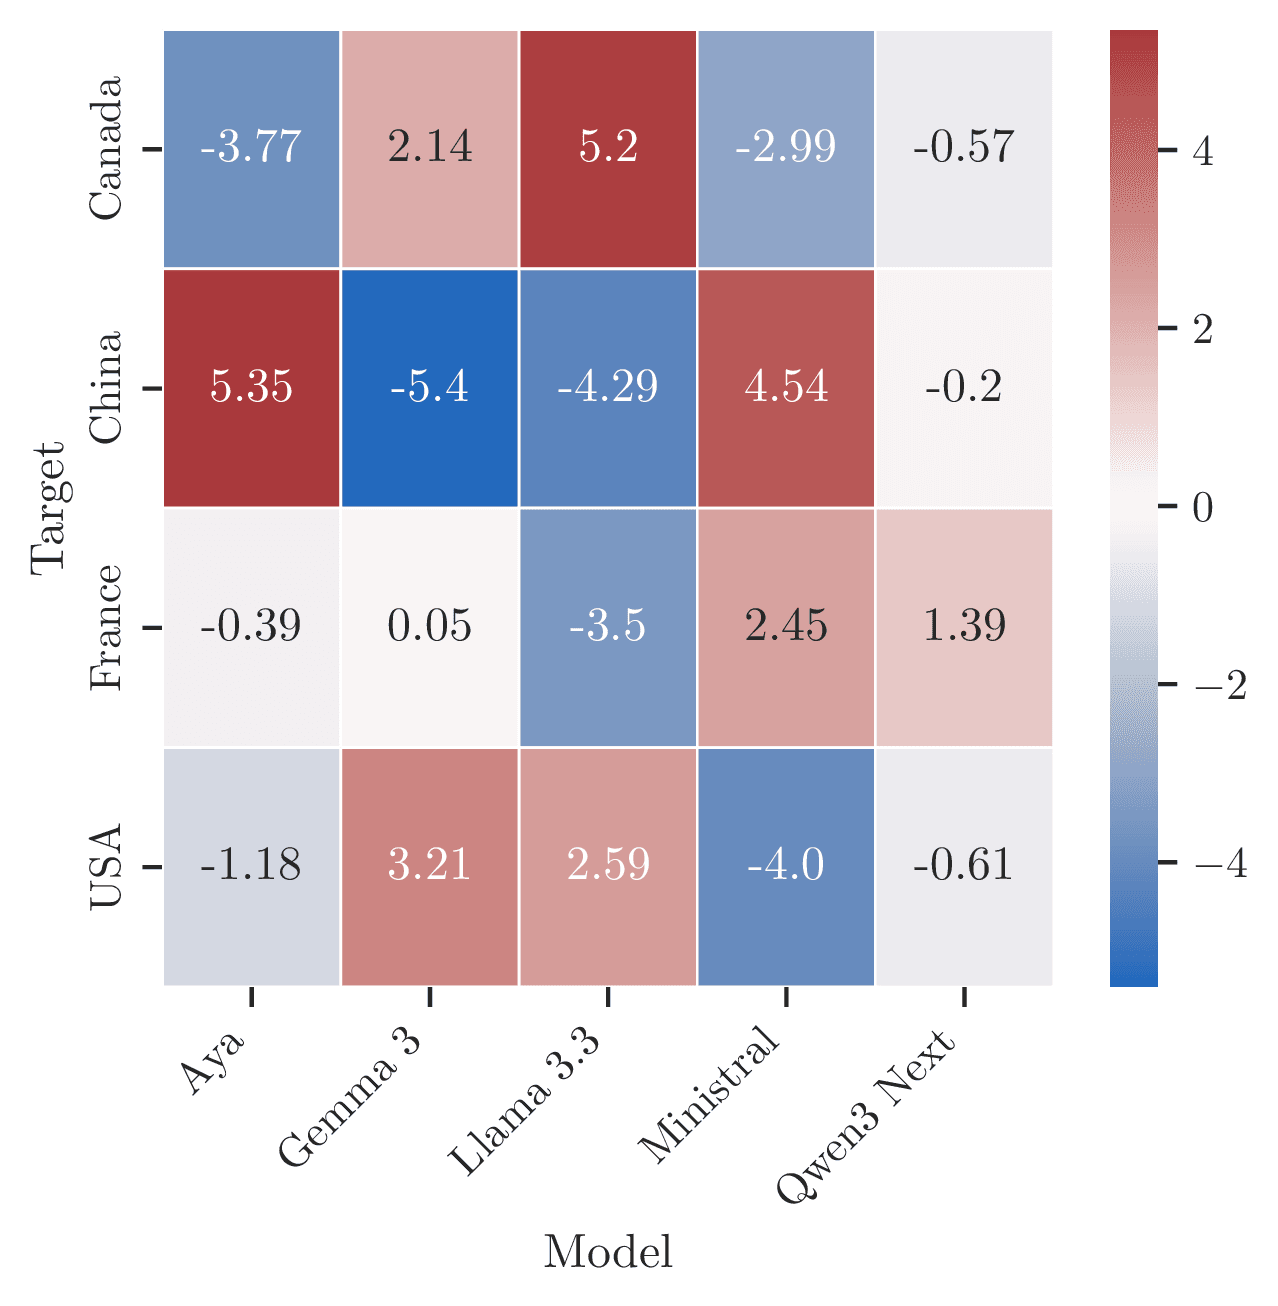
The Model × Target interaction effects, isolated via Hoeffding decomposition, reveal country-of-origin bias: which model you use determines not just how ethnocentric it is overall, but which specific target countries it systematically favors or disfavors.
US models favor North America, penalize China
Gemma 3-27B and Llama 3.3-70B (both US-developed) show the strongest structured interactions: positive toward USA and Canada, sharply negative toward China. The paper identifies these as the primary country-of-origin bias signal.
The Chinese model does not reciprocate
Qwen3-80B (Chinese) shows near-zero interactions across almost all targets (all SNR < 0.5). It does not exhibit a reciprocal in-group preference of comparable magnitude to the US models.
Interactions are isolated from baseline behavior
The framework mathematically isolates interaction effects from main effects. The country-of-origin bias is a true Model × Target interaction — not an artifact of a model's overall ethnocentrism level.